Completion requirements
We will collaborate to build this glossary of term to help us extend our vocabulary for this course. We need to include key terms which are unfamiliar and will be good to know for the upcoming exam in January.
We will collaborate to build this glossary of term to help us extend our vocabulary for this course. We need to include key terms which are unfamiliar and will be good to know for the upcoming exam in January.
Browse the glossary using this index
Special | A | B | C | D | E | F | G | H | I | J | K | L | M | N | O | P | Q | R | S | T | U | V | W | X | Y | Z | ALL
B |
|---|
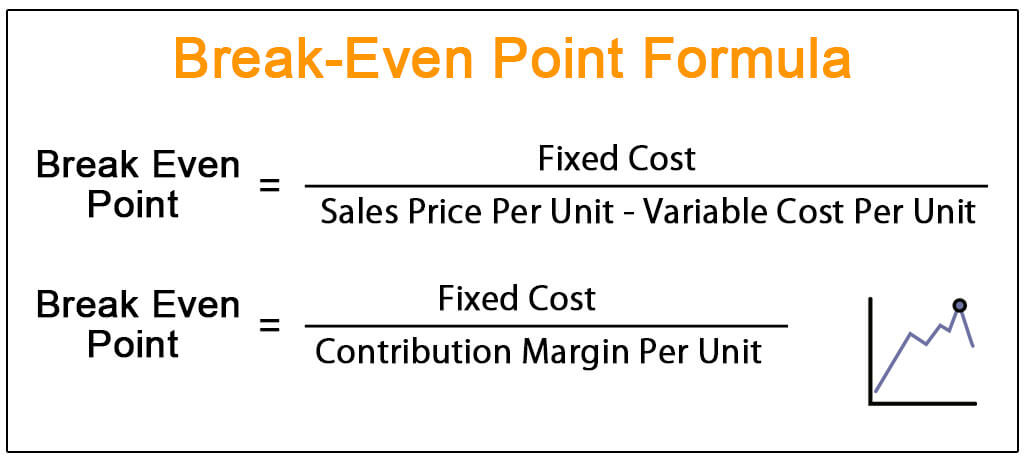
Break even chart example
| |
Break Even Chart ExplainerSelect the link below to access an explainer video | |

